Stellar activity with GALEX
06 Mar 2017At the ISSI meeting I attended on quasi-periodic pulsations (QPP’s) in stellar flares in Switzerland in 2017-March, we had a great demo of the time-tagged photon data from GALEX by Scott Flemming & Rachel Osten, and the Python toolkit called gPhoton. This enables high time resolution (maybe 1sec) studies of stellar variability in the NUV (and FUV). Many projects came to mind from our group with this tool/dataset, including searching for QPP’s naturally.
Long-Term Variability
Some sources available with gPhoton have data from up to 10 years of repeated visits with GALEX! This caused me to wonder about the possibility of seeing long time-scale variability in the UV, which we might use to observe stellar activity cycles using GALEX! By using a list of Mt. Wilson H&K stars from Duncan et al. (1991), I wrote a quick Python script to ping the gPhoton database and count how many visits to each star were available.
Note: After corresponding with the gPhoton folks, it seems this may be a less efficient approach, and that an SQL-style database is also available for visit-level data that may suffice. Comparison of gPhoton with this coarser data is required!
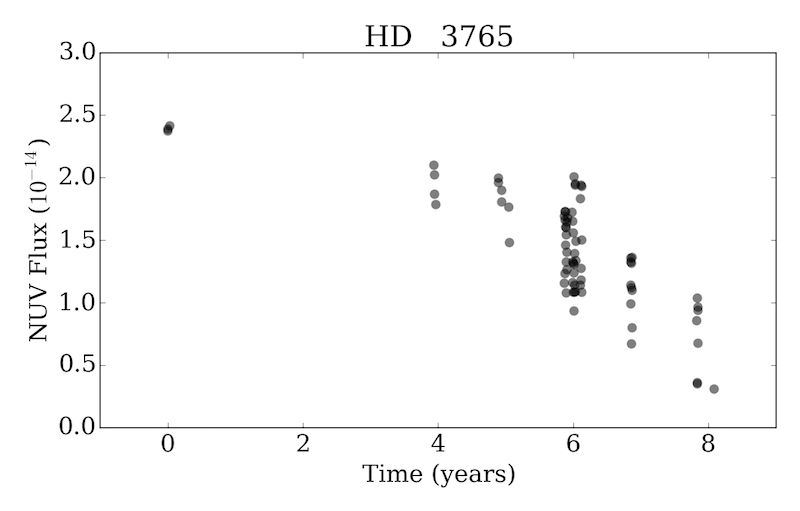
Here is the decade long light curve for one star, chosen to have the largest number of visits available (over 70). Each data point is the median flux value within the visit. The evolution is very interesting!
Next Steps
- Create a similar light curve for every Mt. Wilson (and other H&K survey) stars, looking for long-term variations.
- Compare the gPhoton with SQL-level data, to ensure variability is real
- Compare with the Gezari et al. (2013) catalog of variable GALEX sources
Age-Activity
Following my recent exploration of rotation period distributions using Kepler & Gaia data, I was keen to see if the GALEX data showed any correlation between UV flux and stellar age. Activity levels traced versus stellar age with GALEX have been explored by Shkolnik & Barman (2014), using stars with known ages from clusters.
Instead of gPhoton, I used a dedicated dataset built from GALEX observations of the Kepler field by Olmedo et al. (2015). Using the excellent CDS X Match Service, I quickly and effortlessly matched this catalog to the McQuillan et al. (2014) rotation period dataset. To get more photometry, I then matched this combined catalog to SIMBAD with X Match. In a matter of 30 minutes from the airport I was able to get the data to make this figure:
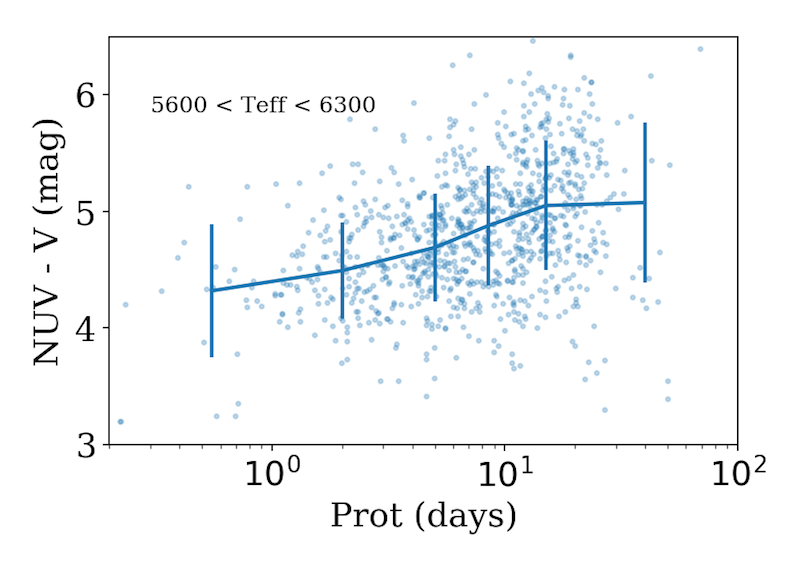
For stars with a small range of temperatures, we can see the NUV flux appears to decrease compared to the V-band as a function of rotation period. Here I use the NUV-V color, as it is distance independent, and small bins in temperature to minimize the effect of different stars inhabiting different ranges of rotation period causing artificial spreads in the color. The evolution of less UV activity with increasing age (rotation period) is in the direction that is expected. However, the scatter is quite large.
Next Steps
- Improve sample selection with quality cuts for all data.
- Make similar plot for all available temperature bins
- Make plot as a function of Rossby number instead of rotation period
- Using a gyrochronology relation to infer rotation ages, plot the expected UV flux (or NUV-V color) from the fits of Shkolnik & Barman (2014) versus the GALEX data.
- Can we see a saturation regime with this data? If so, this dataset may be a valuable and large addition to the available sources!
- (Longer term) extend this sample with rotation periods from K2!